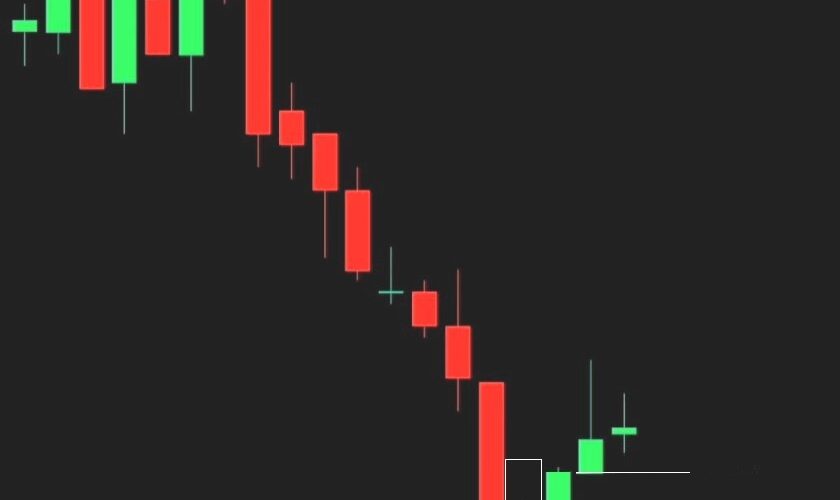
+ 4 other fundamental figures to remember Download and save the PDF with the complete tutorial Taking into account the figures formed by Japanese candlesticks is one of the fundamental skills for the trader. Let us briefly remember that the candle is generally made up of a body, and an […]
Are you sure you know how to use trendlines? Here is the common mistake of traders. Download the full PDF now for free Trendlines are diagonal lines drawn on the chart, which highlight the direction of the market To track them we need to identify two parameters: By connecting the […]
Simple strategy often gives better results than complicated systems. It is easier to master and gives the trader more confidence in making the right decisions. PDF Strategy DOWNLOAD This strategy uses only two very common indicators, the Parabolic SAR and the CCI. The joint observation of the two indicators allows us […]
The strategy is designed for very short deadlines, 30, 60, 120 seconds. It involves the use of 2 indicators for Metatrader 4: Turbo Swing and Turbo Alarm. We place two Metatrader windows in the same monitor: on the left M1, on the right M5. The desktop screen is divided into […]
ForzaForex.it presents a high winrate scalping strategy on 1 Minute Candles and 5/6 Minute Expiry based on the Parabolic Sar signals filtered by the divergence, with positions open only in the direction of the trend. We try it on GC Option, on the Webtrader platform from which we obtain the images, but you can also test it […]
Essential for Beginners DOWNLOAD THE PDF A new PDF dedicated to beginners with understandable technical topics and practical advice for binary options. CONTENTS OF THE 30 PAGE PDF: DOWNLOAD THE PDF
A strategy that identifies and exploits market cycles. PDF FREE DOWNLOAD Japanese candles 30 seconds Expire 15 secondsGrafico Pocket Option OTC 92% Introduction Looking at any graph you can’t help but think about the trend of prices fluctuating up and down. We are certain of one thing: any trend first […]
Have you registered with a broker and made a deposit? Are you aware that every time you use a link, you help support the person who shared it? It’s only fair that you get rewarded for it! When you register via our link, we offer you an exclusive benefit: up […]
Pullback Bollinger Bands Strategy PDF Strategy Download Only two indicators with color signal per Exnova, IQ Option, Pocket Option, Close Option and other. Introduction Bollinger Bands contain market fluctuations. Therefore you can think of bands as levels where prices bounce to move towards the opposite band, and open positions accordingly. […]
Band Cycle Strategy PDF DOWNLOAD Tradingview 5 minute strategy for Exnova, IQ Option, Pocket Option, Close Option Introduction This strategy opens trades based on the trend change signal indicated by the “Ultimate” band indicator. During our tests it proved to be particularly valid and reliable The change in color of […]
Set up the chart, insert indicators, customize the platform. How Tradingview works. Let’s learn to use the platform. With Tradingview we have charts and indicators available for free. Trades do not open on tradingview, but on your favorite broker. We prepare the chart that we use to receive trading signals. We […]
Very short deadline strategy. :Download MT4 free indicators HERE for 30 and 60 second strategy (content: Sec 60.tpl / Sec 60 Pivot.ex4 / Sec 60 Alert.ex4 / Sec 60 Price.ex4) Secretum 60 is aimed, as you have surely already read in our presentations, at those who have the knowledge of […]
Forex and Binary Options on the IQ Option platform Exnova is a trading platform that allows you to trade various assets online: stocks, forex, commodities, binary options, digital options and cryptocurrencies (No CEE countries) Payouts are good, often 85% on major pairs and 90% on OTC. OTC market always open. […]
Binary Options and Pocket Option We exploit price rebounds on the moving average only by following the trend Download this free PDF Strategy Now This strategy opens trades as soon as a change in trend is confirmed from the bounce on the SMA 7 Moving Average. The signal is opened only in […]
New Binary Options and Forex Broker “No Esma” The Finteria broker accepts Italian clients. Finteria is a binary options, forex and CFD broker that has been present since 2021, but at the end of 2023 it completely changed its appearance and performance, so much so that we can consider it as a completely […]
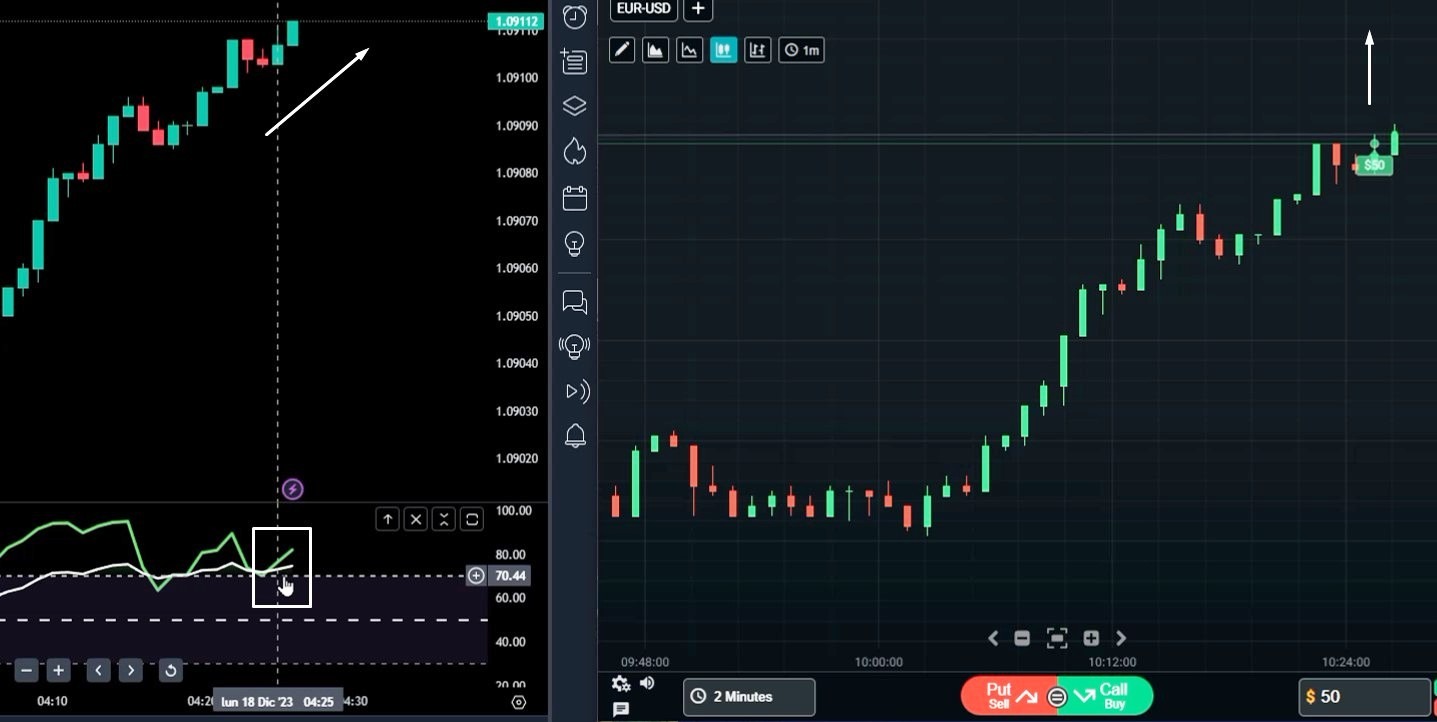
Pocket Option and Close Option Strategy with Signal from Trading View Do you want the PDF to keep right away? Download it here for free This strategy opens operations as soon as a change in trend is confirmed by the crossing of the lines of two RSI indicators with different […]
Close Option is a broker specializing in binary options trading, with an online platform accessible via browser without the need for download. Founded in 2013, it offers a trading experience for over 2.2 million users worldwide. Close Option Link http://bit.ly/CloseOptionDemo In summary our experience with pros and cons Pro Maximum reliability with […]
NEW LINK POCKET OPTION DEC 2024 https://u.shortink.io/smart/NBsHaX7rcA7Oqj Pocket Option Review (Updated August 2024) Among the various topics in this article you will find: New Pocket Option Universal Link How to get started with Pocket Option How to carry out a trading operation How to use Indicators on Pocket Option How to interpret […]
Welcome to our “Knowing Indicators” series. Today we will talk about a very popular and powerful indicator: the MACD, or Moving Average Convergence Divergence. We’ll explore what the MACD is, how it works, and share an easy trading strategy you can use. What is MACD The MACD is a momentum […]
Finally the RSI divergence explained easily What is RSI: The Relative Strength Indicator (RSI) is a tool used in technical analysis to evaluate the speed and magnitude of price movements. Essentially, the RSI measures whether an asset has been overbought or oversold and can help you identify potential trend reversals. […]
Bollinger Bands are a technical analysis tool invented by John Bollinger in the 1980s. It is an indicator that helps traders evaluate the volatility of a market and identify moments when a price could be considered high or low compared to its historical average. Bollinger Bands are made up of […]


