Finally the RSI divergence explained easily
What is RSI:
The Relative Strength Indicator (RSI) is a tool used in technical analysis to evaluate the speed and magnitude of price movements. Essentially, the RSI measures whether an asset has been overbought or oversold and can help you identify potential trend reversals.

How RSI works
The RSI is based on a range from 0 to 100 and is calculated using the average of the positive and negative closing price changes over a given period of time. Typically, the RSI uses a 14-day period for its measurements, but this can be adjusted to personal preferences.
RSI Signals
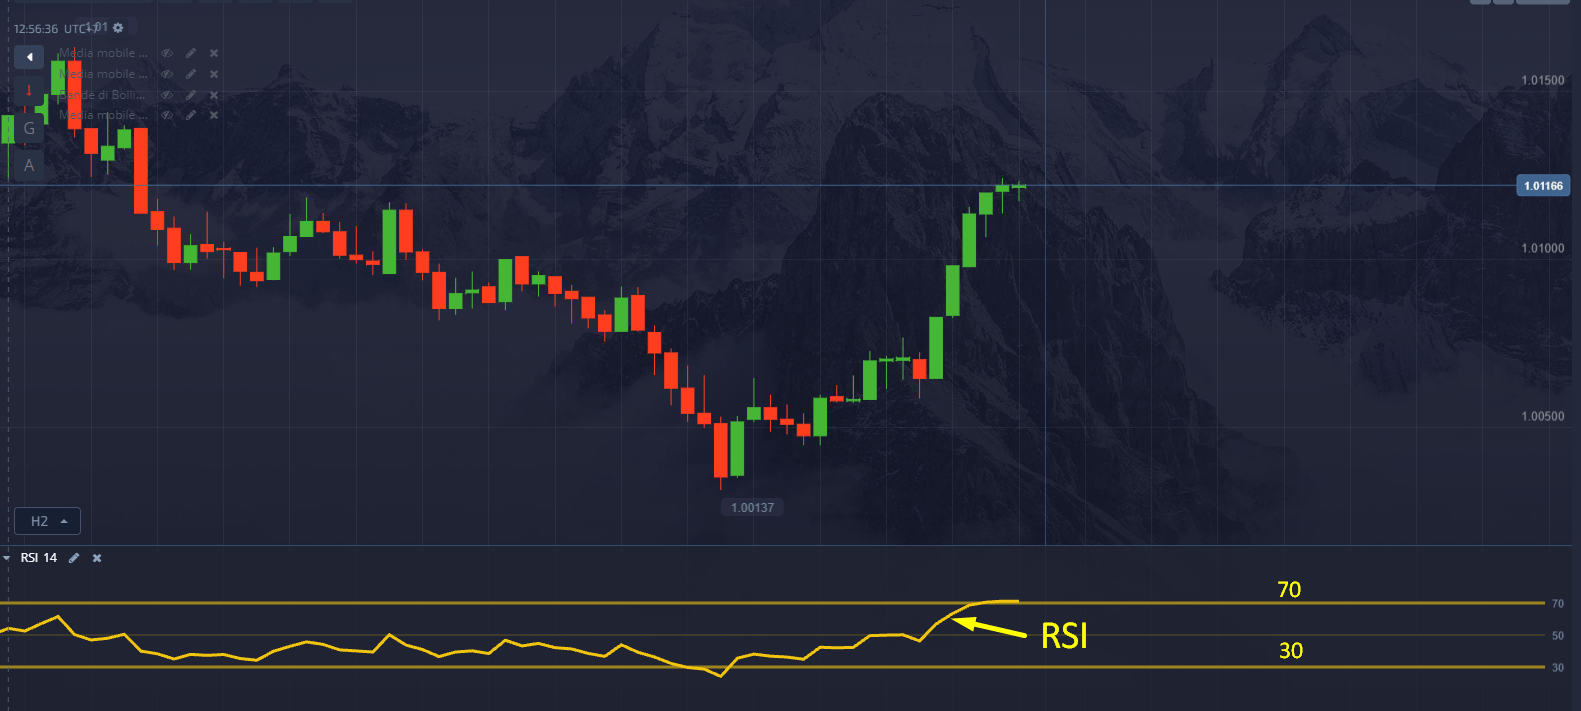
When the RSI approaches 70 or above that level, the asset is considered overbought, which could indicate a possible bearish reversal. Conversely, when the RSI approaches 30 or falls below this level, the asset is considered oversold, suggesting a potential upside reversal.
RSI Trading Strategies
- Overbought and oversold levels: Use the 70 and 30 levels of the RSI to identify market entry or exit opportunities. For example, when the RSI rises above the 70 level, you may consider selling, while when it drops below 30, you may consider buying.

2. RSI Divergence : Look for situations where the asset price forms a higher high while the RSI forms a lower high at the same time. In that case you get a possible sell signal.
Here are some examples:


Conversely, if you notice a lower low while the RSI forms a higher low you get a possible buy signal.
Here are some examples:


Tip: You can memorize the entry direction by looking at the direction of the RSI trendline

3. Trend Confirmations : Use the RSI in conjunction with other technical analysis tools, such as moving averages, to confirm market trends. If the RSI indicates an overbought or oversold situation and this also occurs in conjunction with other confirmatory signals, there may be a greater probability of success in predicting the price direction.


