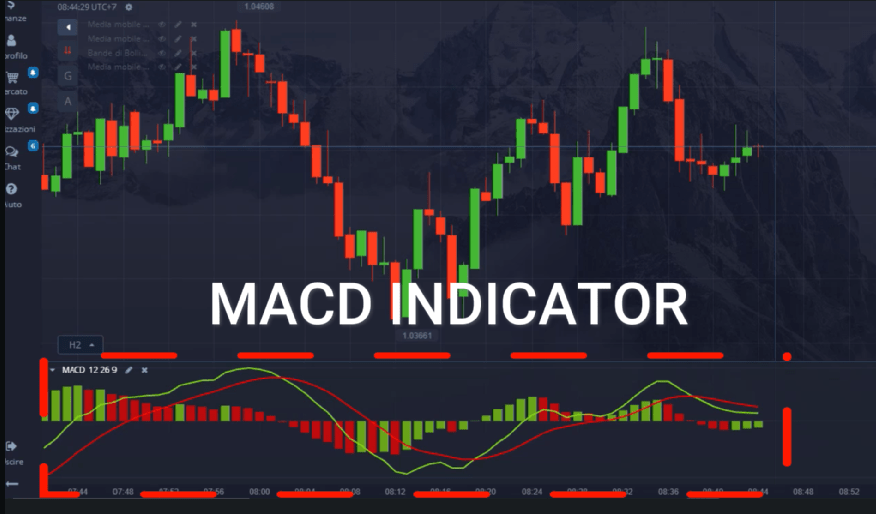
Welcome to our “Knowing Indicators” series. Today we will talk about a very popular and powerful indicator: the MACD, or Moving Average Convergence Divergence. We’ll explore what the MACD is, how it works, and share an easy trading strategy you can use.
What is MACD

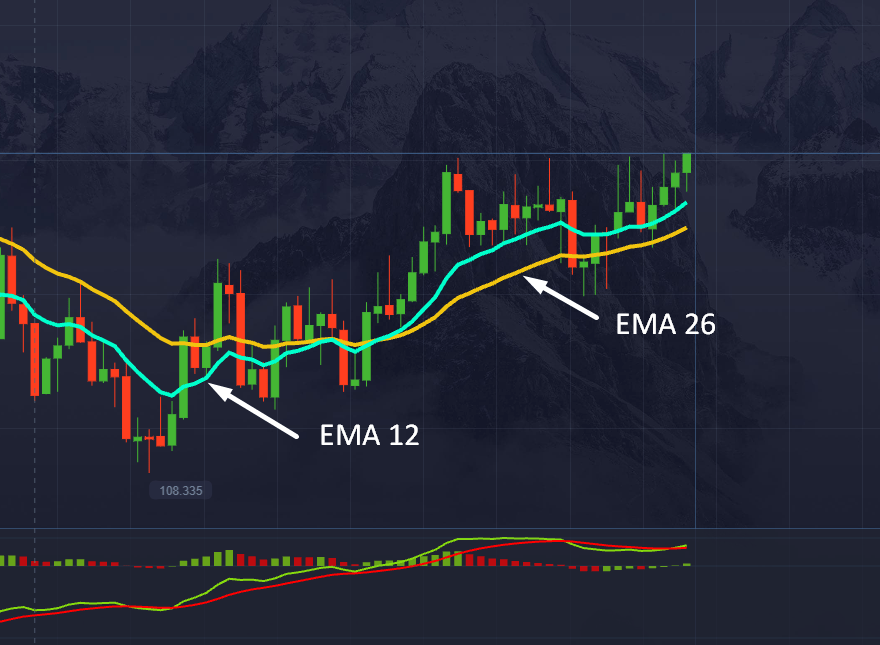
The MACD is a momentum indicator that helps traders identify changes in the direction of an asset’s trend. It is based on the difference between two exponential moving averages, (EMA), of different periods. These moving averages are subtracted from each other to create the MACD value.
How the MACD works

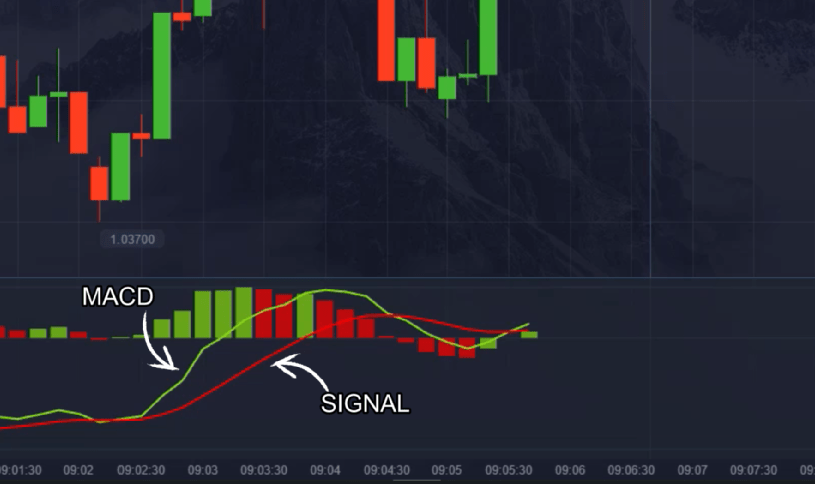
The MACD is made up of three main elements: the MACD line, the signal line and the histogram. The MACD line represents the difference between the two exponential moving averages, while the signal line is a moving average of the MACD histogram itself. The histogram displays the distance between the MACD line and the signal line.

MACD Trading Strategy
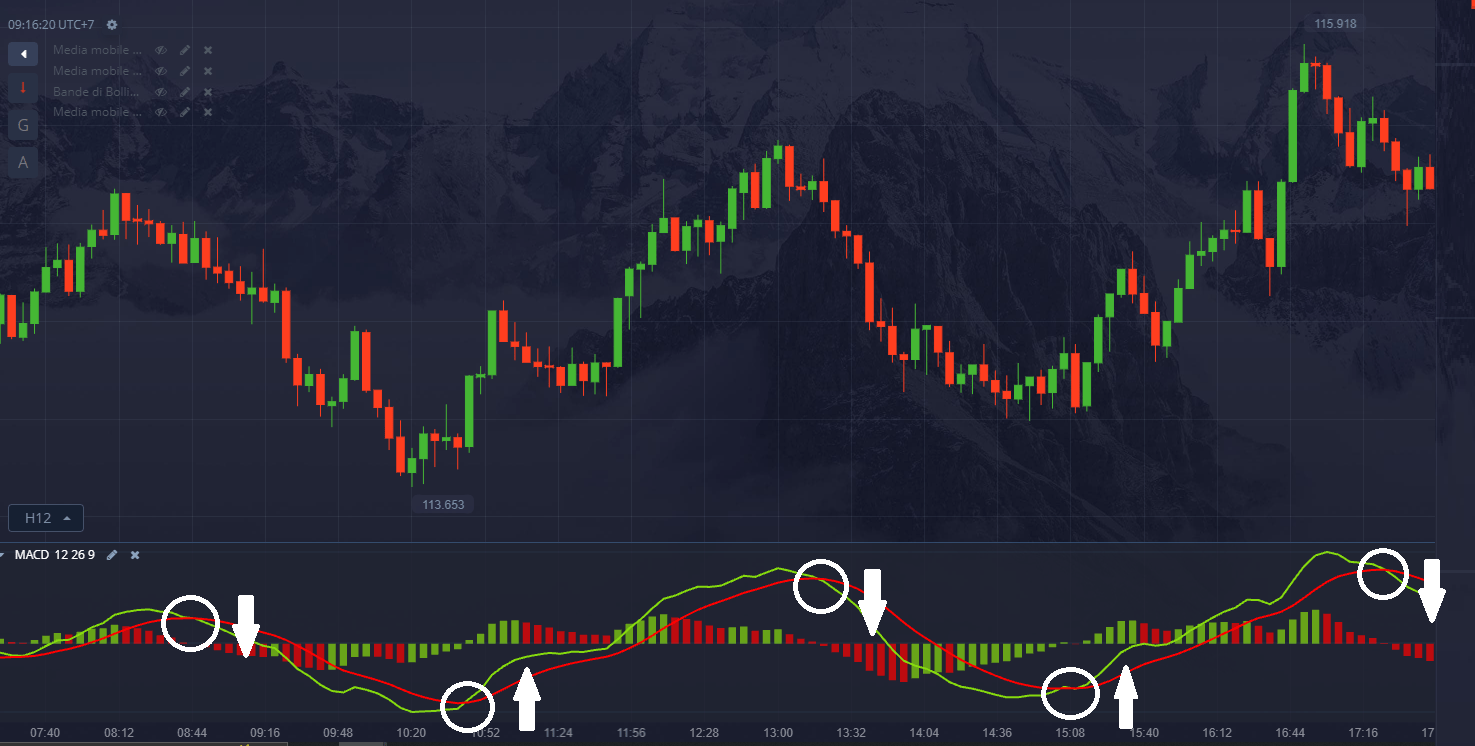
A common strategy with the MACD is to use crossover signals between the MACD line and the signal line to identify possible entry and exit points in the market. For example, a buy signal occurs when the MACD line crosses above the signal line, indicating an upward reversal. Conversely, a sell signal occurs when the MACD line crosses below the signal line, signaling a bearish reversal.

In summary, the MACD is a momentum indicator that can help you identify changes in market trends. By using crossover signals between the MACD line and the signal line, you can develop an effective trading strategy.
You can follow other videos on trading indicators by subscribing and following our channels.


