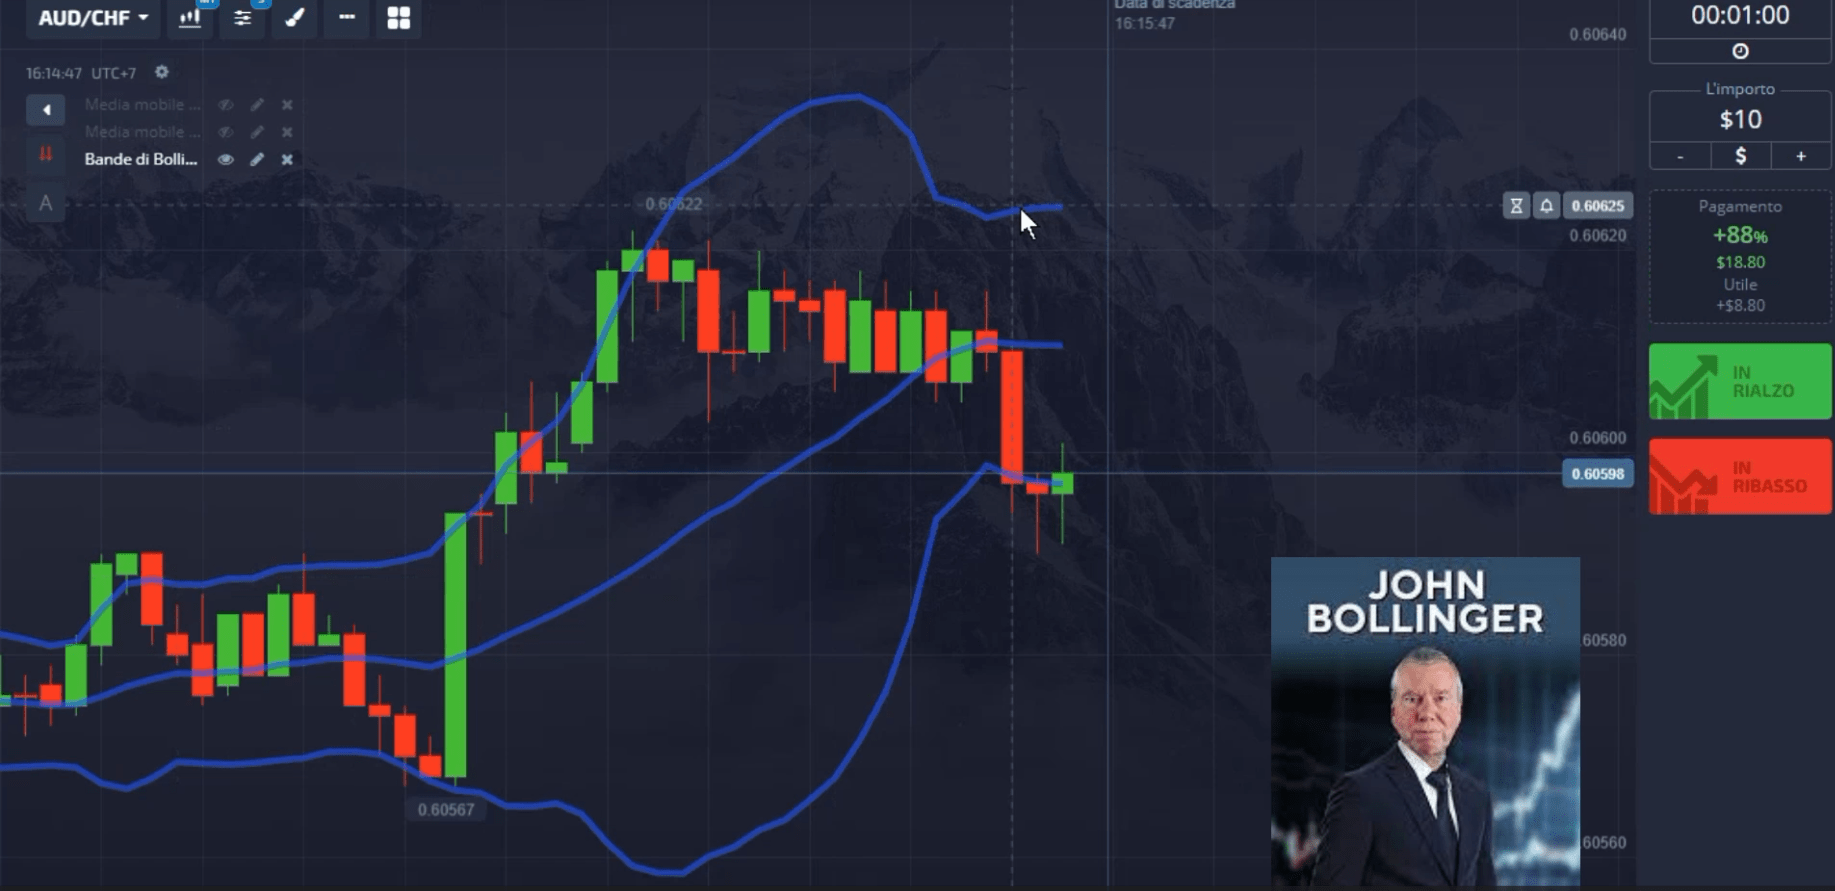
Bollinger Bands are a technical analysis tool invented by John Bollinger in the 1980s. It is an indicator that helps traders evaluate the volatility of a market and identify moments when a price could be considered high or low compared to its historical average.

Bollinger Bands are made up of three lines: a simple moving average and two standard deviation bands, one upper and one lower. The moving average represents the average price of an asset over a specific period of time, while the standard deviation bands are positioned above and below the moving average at a distance that depends on market volatility.

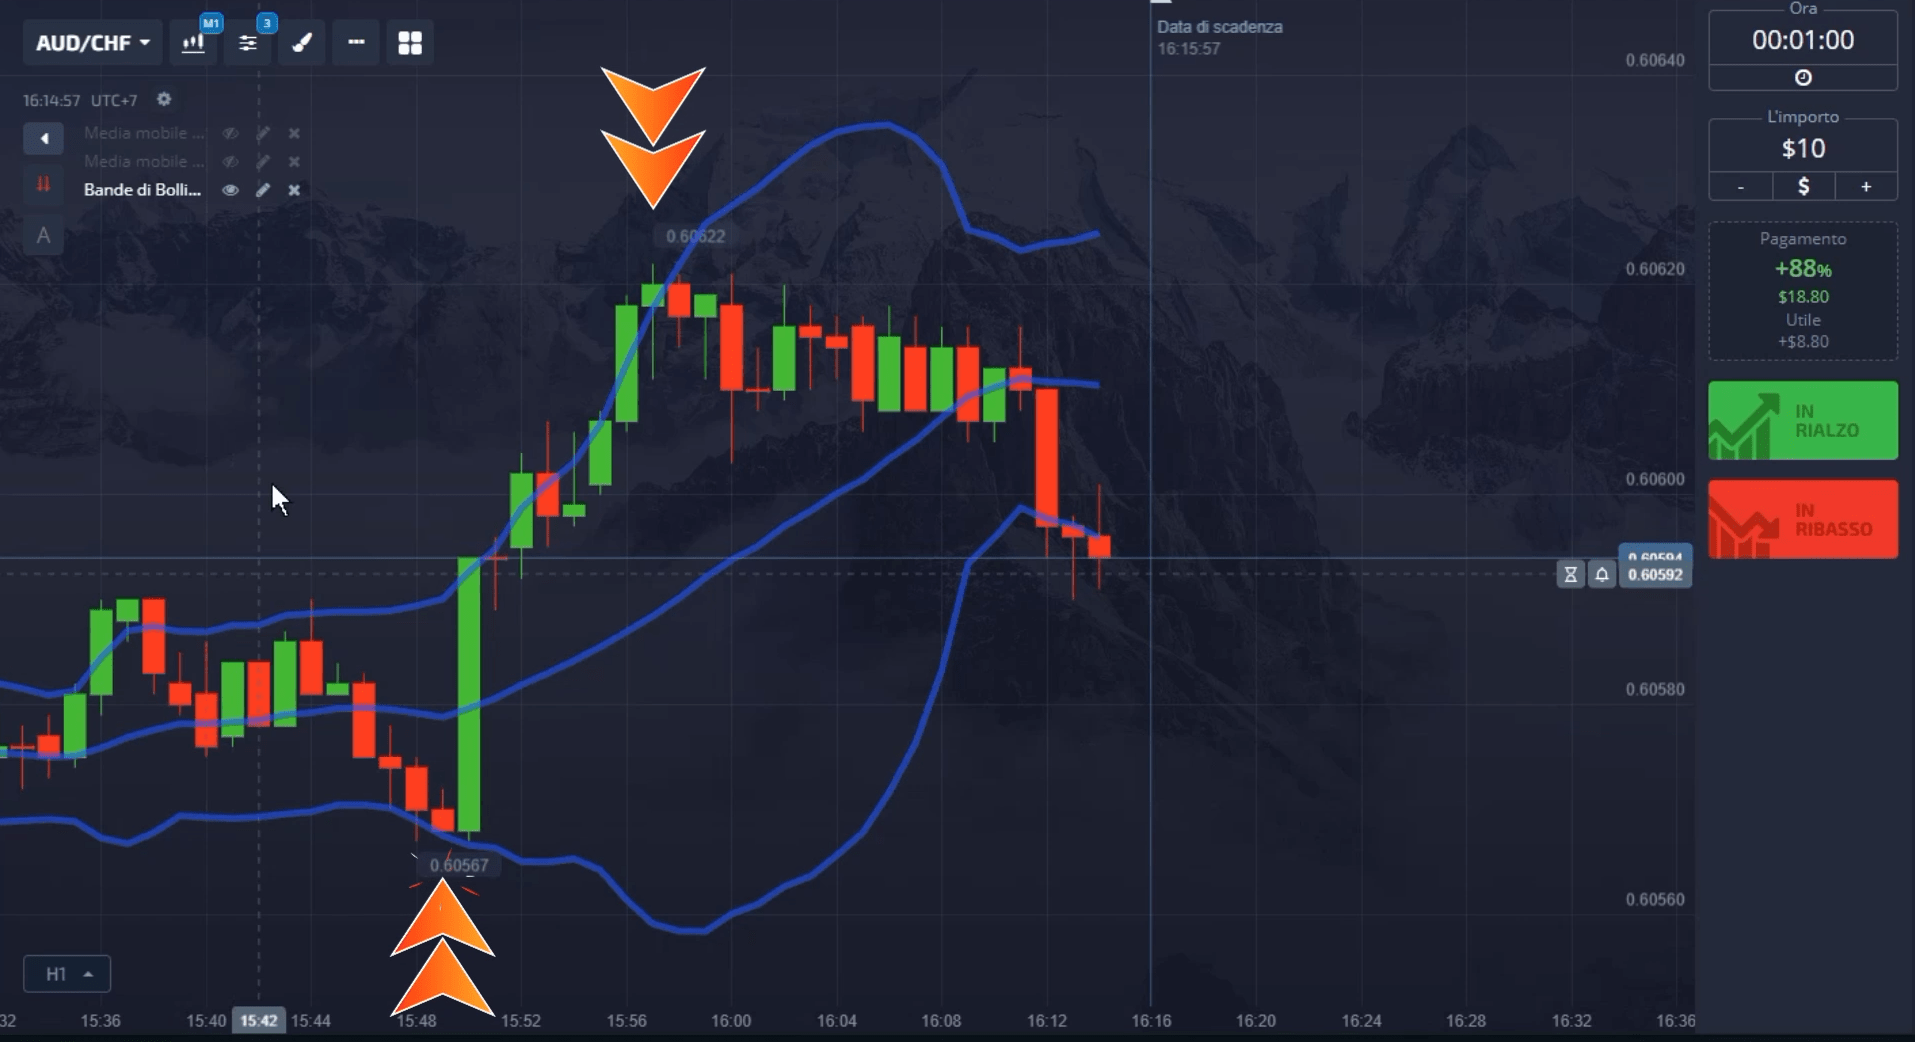
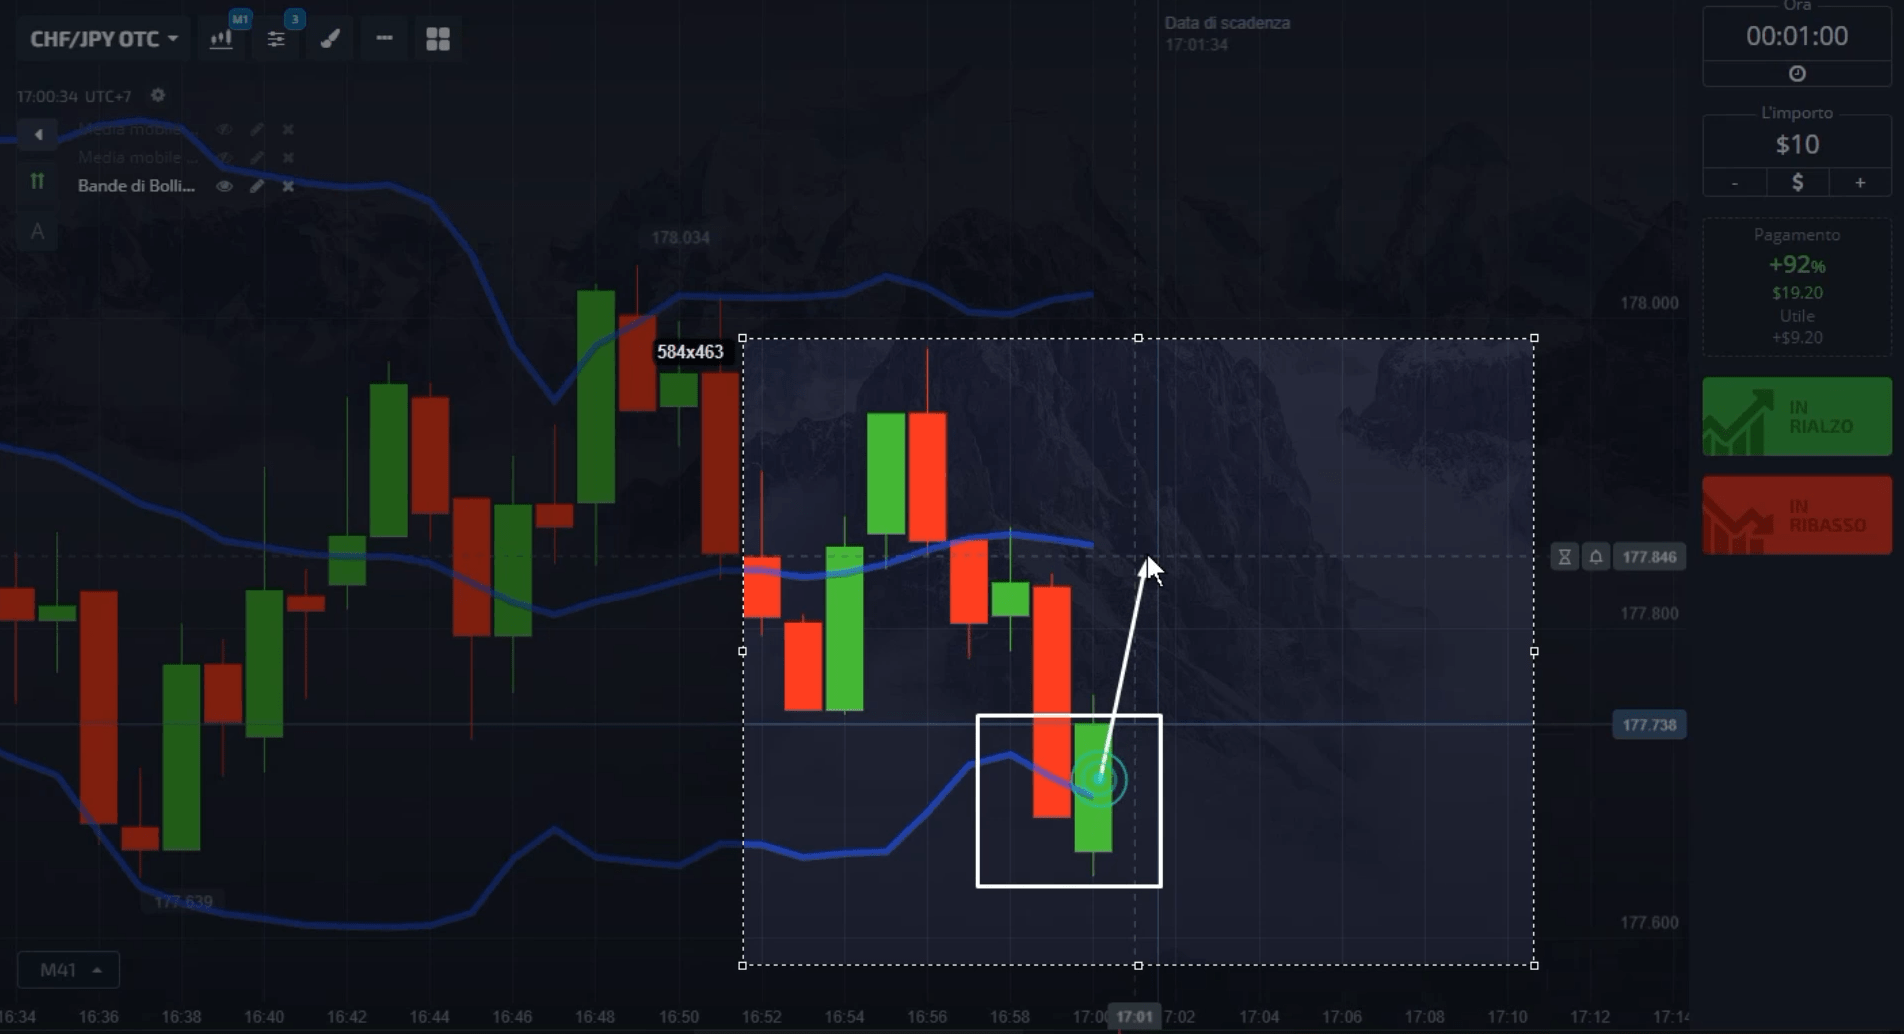
When the price of an asset approaches the upper band, it could be considered “overvalued”, while when it approaches the lower band it could be considered “undervalued”. However, it is important to note that Bollinger Bands do not provide trading signals on their own, but should be used in conjunction with other tools and strategies to make informed decisions.

There are several strategies that traders can use with Bollinger Bands. One of these is the “bounce” strategy, in which we try to identify the points where the price touches one of the bands and then returns in the opposite direction. Another strategy is the “breakout” strategy, in which you try to capitalize on a possible breakout of the bands, which could indicate a change in the market trend.
In our YouTube channel you will find detailed strategies based on Bollinger Bands.

