+ 4 other fundamental figures to remember
Download and save the PDF with the complete tutorial
Taking into account the figures formed by Japanese candlesticks is one of the fundamental skills for the trader.
Let us briefly remember that the candle is generally made up of a body, and an upper and lower shadow.

A green candle indicates that prices are rising, a red one indicates that prices are falling
At the ends of the body there are the opening and closing. At the ends of the shadows the maximum values reached.
Let’s now move on to the patterns formed by candlesticks, the purpose of which is to predict the future behavior of the market, what we traders need.
- PATTERN ENGULFING
One of the most important is the ENGULFING PATTERN formed by two candles, the second of which has a larger body than the previous one, and whose color gives an indication of the future direction of the price.

Engulfing bullish on the left and bearish on the right
Here are some examples.
Here a bearish engulfing pattern has formed:

Entry after the pattern is confirmed, at the opening of a new candle.
Expiry for binary options approximately two candles .

Here’s another example:

Next candle opening entry:

- Doji Patterns
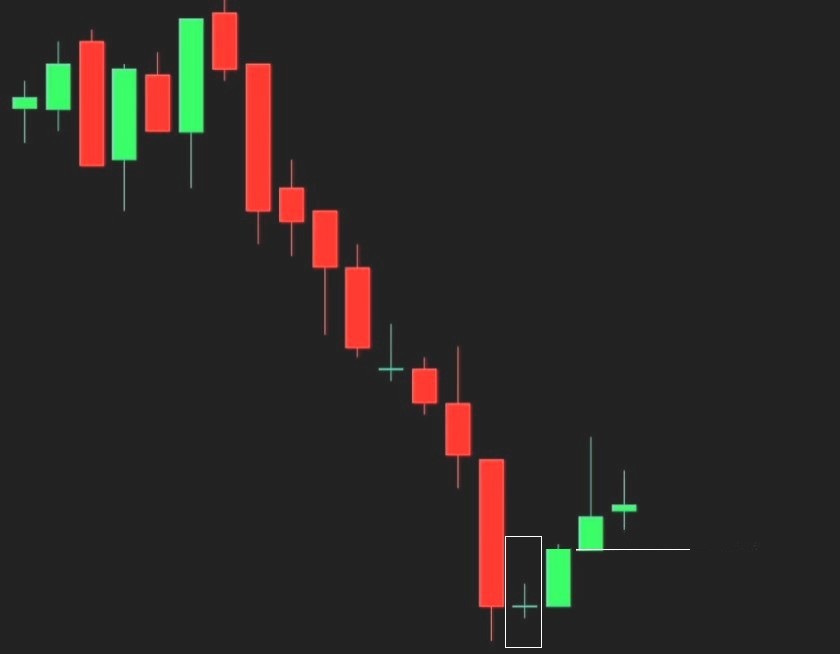
Doji is a candle with a very small body and long shadows:

It highlights a certain indecision on the market, which finds it difficult to proceed in the same direction. Anticipate a possible reversal.
Let’s see some examples. Let’s see that a doji has formed:

Wait for a subsequent reversal confirmation candle:

And we open the operation:

Let’s see another example with the Doji pattern

After the formation of the doji we await a new candle that confirms the change of direction:
When it closes we open the operation:

- PATTERN MOMENTUM
It is made up of two candles of the same color. The second is about two or three times larger than the first.
It’s a continuation pattern. The price should continue in the same direction.

Here is an example:

To confirm the pattern we open the operation

In this other case we have a bearish pattern:

- MARUBOZU PATTERN
Marubozu is simply the name given to a candle with a large body and no shadows, like the central one in the figure:

Let’s see two examples:

Marubozu bullish

Marubozu bearish
- HAMMER and SHOOTING STAR
They consist of a small body and a long shadow at one end. Both indicate a continuation of the market’s direction.
The Hammer has the body up and the Shooting Star has the body down.
Let’s see an example:

After a downtrend a Hammer appears. At the close of the candle, the operation opens in the opposite direction.
Conversely, after an uptrend a Shooting Star appears. At the close of the candle, the operation opens in the opposite direction.

Recommended brokers
As a broker we recommend, in addition to the popular Pocket Option , also Close Option.
For Forex/CFD IQ OPTION and EXNOVA . They also have binary options (but not for Europe). On SABIOTRADE you trade with the broker’s money.

Exnova and Iq Option have practically identical platforms
You can find Binary Options from Metatrader on GC Option and also Forex on the same site with Grand Capital .


