Learn the 10 Most Popular Indicators MetaTrader in 10 Minutes
Given its importance, we recommend that you save this page as a favorite. For convenience you can download the free PDF (form at the end of the article) and keep it for ease of reference.
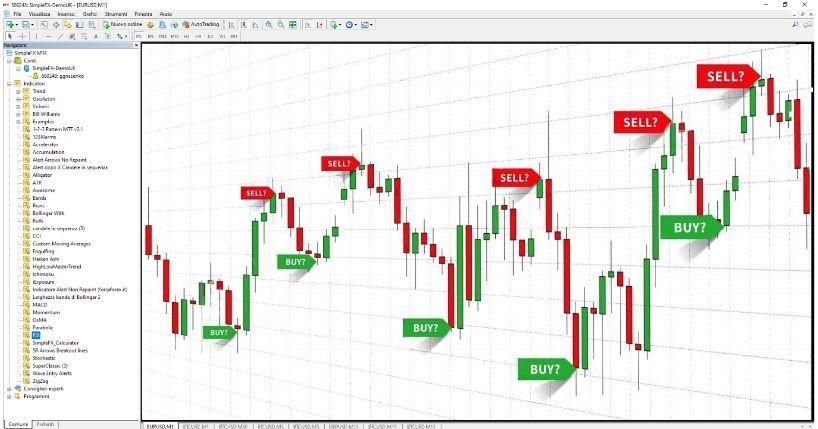
Those who approach the world of trading need to immediately use the indicators most used by experts. Here is a quick guide of 10 famous indicators to understand how they work and use them immediately.
You don’t need to know mathematical formulas and indicator theory. To start immediately you need to know how to recognize the entry signals of these graphic tools.
1. Moving Average (MA)

This is a trend-following indicator that’s used to smooth out the noise on the price chart and determine potential upward or downward trends.
An indicator of an upward trend happens when the chart crosses the line from below upwards; when the chart crosses the MA from above downwards it may signal a downward trend.
Moving Averages can be combined with any oscillator and can be effectively used in many trading strategies.

Moving Average Crossover Strategy
2. Alligator
It consists of three Moving Averages with different periods: they are often called the jaw (red line), teeth (orange line) and lips (yellow line) of the Alligator.
The indicator shows no trend periods when the bands are sideways and emerging trends when the lines widen away from each other (the Alligator’s mouth opens).
A Buy signal is received when the lips cross the teeth upwards. If the lips cross the teeth downwards, it may be a signal of a downtrend.

3. MACD (Moving Average Convergence Divergence)
The goal of this indicator is to spot emerging trends. The indicator is composed of two exponential moving averages and one simple moving average with default period set to 9.
There is a histogram (gray) and a signal line (red).
The MACD oscillator (gray) fluctuates above and below the zero level. The trend is considered to be bullish when the MACD is trading above the zero line and considered to be bearish when it is trading below the zero line. MACD trading signals are simple to interpret and goes a follows:
- Buy Trade: Go long when the indicator gray trades above the zero level from below, trend changes from bearish to bullish.
- Sell Trade: Go short when the indicator gary trades below the zero level from above, trend changes from bullish to bearish.
The signal line red that crosses the histogram indicates that the push is over. It is used for forex but not for binary options.
4. RSI (Relative Strength Index)

RSI is an oscillating indicator used to determine the trend strength as well as possible reversal points.
The indicator moves between the two levels and the asset is considered overbought if it moves above the 70% level and oversold if it breaks through the 30% level.
According to the indicator, once the asset reaches one of the areas, the price might reverse and go the opposite direction. RSI combined with a Simple Moving Average and MACD form a popular trading strategy.

5. Stochastic Oscillator

This indicator doesn’t follow the price, but it follows the speed or the momentum of the price. And as a rule, the momentum changes direction before price. So this indicator may help traders to find trend reversal points. It consists of two MAs (fast and slow) and two horizontal lines (overbought and oversold levels).
A signal to Buy, for example, is received when the blue line is crossing the red line upwards and when the lines meet below the oversold level and are coming back up.
An example of a Sell signal is when the blue line crosses the red moving average downwards; also when the lines meet in the overbought area (over 80) and are coming back down.

6. Bollinger Bands

The indicator consists of a moving average and two bands, above and below the MA. When these bands are far apart, it indicates high volatility.
A signal to Buy is received when the candlesticks cross the bottom band upwards.
A Selling signal is received when the chart crosses the upper line downwards.
Reversal is detected when the candlesticks cross the moving average in any direction.
7. (ADX) Average Directional Movement Index
ADX displays the strength of the trend. It is a leading indicator that is normally used with the standard settings. ADX does not provide Buy or Sell signals. It can be successfully combined with Bollinger Bands. The greater the value of the seagreen line, the stronger the trend. The green line above the yellow line indicates an up trend, the green line below the yellow line indicates a down trend.

8. Fractal

The main idea of the Fractal is to show the minimum and maximum of the price curve and indicate the trend reversal points on the chart.
Many traders use it to help set the support and resistance levels.

The Fractal indicator signals a downtrend when the highest candlestick in the middle is followed by two lower candlesticks, the Fractal is facing upwards (as shown in the example above).
An uptrend is emerging when a lowest candlestick is followed by two higher candlesticks, with the Fractal facing downwards.
9. Awesome Oscillator
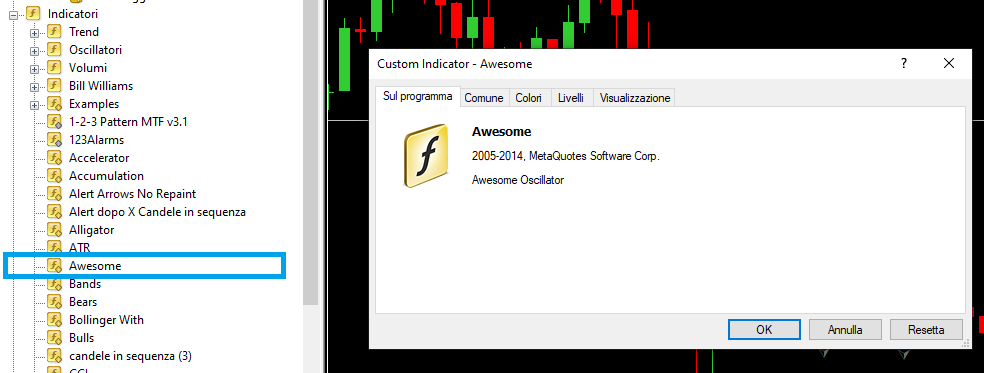
As a lagging indicator, the Awesome Oscillator follows the price, therefore it doesn’t predict the future developments and works best during trending periods. It is considered a simplified version of the MACD indicator.
For example a Buying signal is received when the bars move from below to above the baseline, while a Selling signal can be observed when the bars switch from above to below the baseline.

10. MFI (Money Flow Index MT4)

A basic use of the Money Flow Index is to indicate when the market is overbought or oversold. Values lower than 20 usually suggest an oversold market. Conversely, levels higher than 80 suggest an overbought market. These levels are marked on the chart as a grey dotted line.
Conventional wisdom contends that there is an increased chance of a reversal at such points.
An MFI indicator strategy is to apply a moving average (MA) to the indicator and to use crossovers of the main value across the MA as trading signals.

CONCLUSION
Whichever indicator you choose, don’t forget to study and apply it correctly. The indicator is only a tool in the hands of a trader, it is not able to provide surprising results by itself.
Apply one of the indicators you discovered today, combine it with your skill for better results. Don’t forget the money management!
DOWNLOAD YOUR PDF
(Your Email on the form below)
Learn 10 Most Popular Indicators in 10 Minutes


